August 2026
Who Needs to Know What?
Who Needs to Know What?
The global CEO of a multinational corporation needs different hurricane information than their local site managers in Honolulu and Tokyo.
To explore this challenge, I created a synthetic corporation, Wallace Inc, with 268 critical infrastructure sites – stores, warehouses, data centers – located all around the world.
And I built a fleet of AI agents, each with unique roles: data analyst, historian, trend and local site analysts, and a risk communicator. Together, the fleet's job is to monitor and analyze real-time risk and decide what information gets shared with whom.
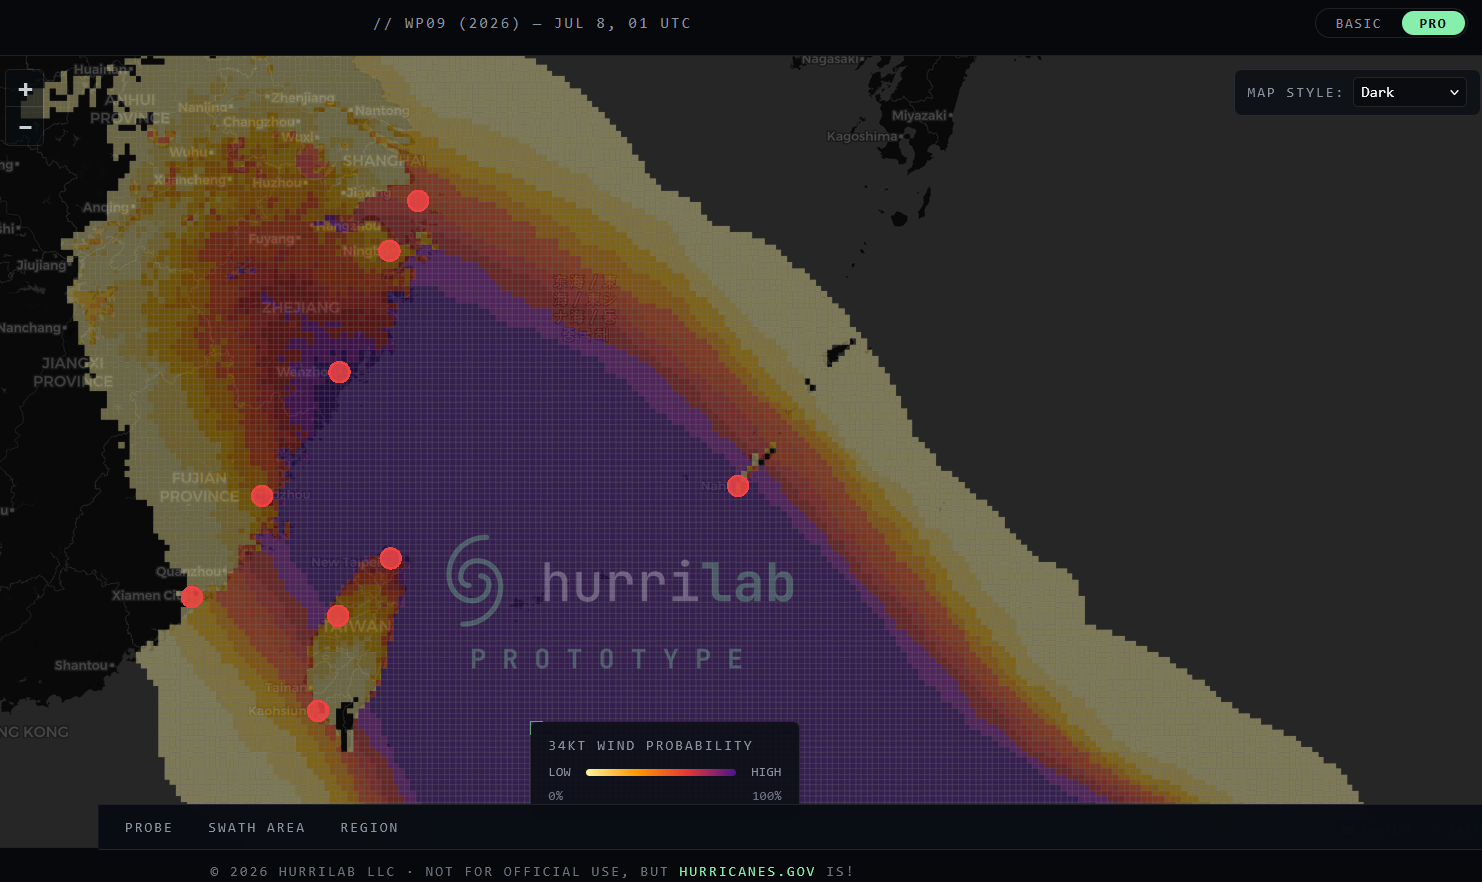
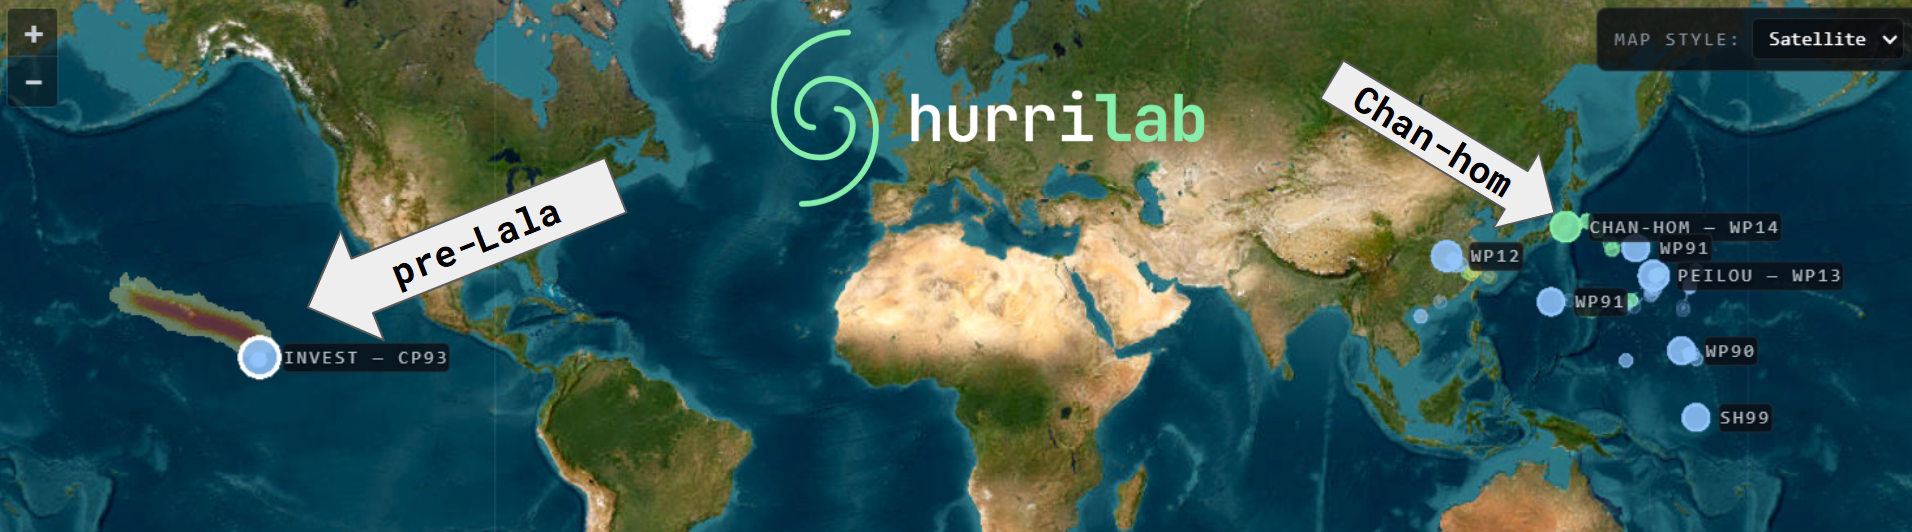
To set the stage, let's rewind to Tuesday, Aug 11 @ 7am ET. Tropical Storm Chan-hom was making landfall near Tokyo, and CP93 – a monitored disturbance that would soon be named Lala – hadn't yet formed.
Every global active and pre-formation system, Aug 11 @ 7am ET:
Although Lala had not yet formed, the HurriLab data strongly suggested that Hawaii would be at risk by the weekend.
34-knot wind probabilities for the pre-Lala disturbance over the next 7 days:
Wallace Inc has operational sites in both Japan and Hawaii. Below is a mapping of Wallace Inc facilities in Hawaii.
11 Wallace Inc facilities across four islands:
I handed HurriLab data and the Wallace Inc global exposure mapping – and nothing else – to the fleet of AI agents tasked with communicating risk to the CEO, regional GMs, and local site managers across the organization.
Here's a snapshot of what came back.
inputs
ai agent outputs
Big picture → CEO
Global view, no science jargon, what's changed, and who to route it to.
“17 of our 268 global sites are inside a storm's wind footprint this morning, all of them in Hawaii and Japan. Our six Tokyo sites are in tropical-storm winds now from Chan-hom, expected to end within hours. All 11 Hawaii sites see some risk from Saturday morning through Sunday afternoon local time, with most affected sites seeing roughly 10-13 hours of it. Risk to Hawaii sites has increased since yesterday. Details should go to the Hawaii and Japan Regional GMs.”
Regional view → Hawaii GM
Storm-specific details, timing windows, and how much to trust them.
“All 11 Hawaii sites are modeled inside the footprint of CP93, currently an invest at 25 kt, east-southeast of the chain at 1,800–2,330 km. Wind windows run from around 7am Saturday 15 Aug (Hilo #1) to around 4pm Sunday 16 Aug (Lihue #1), local time. The forecast is about as uncertain as usual for this lead, with track spread at the 39th–52nd historical percentile for tightness.”
Local details → HONO-04 site manager
One site, local details, and how risk varies nearby.
“Honolulu #4 — 54% at 34 kt (midnight–9:30am Sun, 9.5h), 3% at 50 kt, no hurricane-force window. Risk varies nearby: the 34 kt range within 25 km is about 10% to about 55%, and this site sits toward the high end due to its surveyed exposure.”
Look closely at what's in those messages. You'll see that the agents not only presented the real-time HurriLab probabilistic forecast information, but also historical context on forecast uncertainty, local exposure information for each global site, and recent risk trends. Also notice that the agents stopped short of recommending any actions; that is by design.
The agents don't yet communicate as smoothly and concisely as I'd like to see. They're on the right track, but there's still a bit too much science jargon. Training them on what NOT to say remains a fun challenge!
Next month I'll continue refining the foundational HurriLab data, exercising the agents on live storms, and tightening up how the agents communicate. If you want to make this a real test with your organization's footprint, schedule a meeting and let's talk.
Global coverage, local precision, and stakeholder-specific decision support. There is no one-size-fits-all for hurricane risk.
—Wallace
Book a meeting · HurriLab.com
Graphics shown are experimental prototypes produced by HurriLab LLC, derived in part from ECMWF open data (© ECMWF, licensed under CC BY 4.0), NOAA/NWS data, and Google DeepMind WeatherNext data accessed via Weather Lab. Source data has been modified by HurriLab LLC. HurriLab LLC is not affiliated with, sponsored by, or endorsed by Google, ECMWF, NOAA, or any government meteorological agency. © 2024-5 Google LLC, whose machine learning models were used to create the experimental data made available under the following licence terms https://storage.googleapis.com/weathernext-public/terms-of-use.pdf. This data is intended for experimental modelling only and is not intended, validated, or approved for real world use.